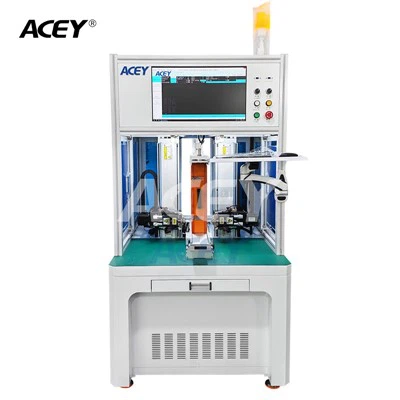
As a supplier of Bms Testing Equipment, I understand the importance of effectively analyzing the data collected by these devices. In this blog post, I'll share some insights on how to analyze the data obtained from Bms Testing Equipment, which can help you make informed decisions and improve the performance of your battery management systems.
Understanding the Basics of Bms Testing Equipment
Before diving into data analysis, it's crucial to have a solid understanding of what Bms Testing Equipment does. These devices are designed to test and evaluate the performance of battery management systems (BMS). They can measure various parameters such as voltage, current, temperature, and state of charge (SOC) of batteries. By collecting data on these parameters, Bms Testing Equipment provides valuable information about the health and performance of BMS.
Types of Data Collected by Bms Testing Equipment
The data collected by Bms Testing Equipment can be broadly categorized into the following types:
- Voltage Data: Voltage is one of the most critical parameters in a battery system. Bms Testing Equipment measures the voltage across individual battery cells and the overall battery pack. Voltage data can help identify issues such as over - voltage, under - voltage, and voltage imbalances among cells.
- Current Data: Current data indicates the flow of electrical charge in the battery system. It includes charging current, discharging current, and standby current. Analyzing current data can reveal problems like excessive charging or discharging rates, which can affect the battery's lifespan.
- Temperature Data: Temperature has a significant impact on battery performance and safety. Bms Testing Equipment monitors the temperature of battery cells and the surrounding environment. High temperatures can accelerate battery degradation, while low temperatures can reduce battery capacity.
- State of Charge (SOC) Data: SOC represents the amount of charge remaining in the battery. Accurate SOC estimation is essential for proper battery management. Bms Testing Equipment uses various algorithms to calculate SOC based on voltage, current, and other factors.
Step - by - Step Guide to Analyzing Bms Testing Data
1. Data Cleaning
The first step in data analysis is to clean the collected data. This involves removing any outliers, missing values, or incorrect data points. Outliers can distort the analysis results and lead to inaccurate conclusions. For example, a sudden spike in voltage data may be due to a measurement error rather than a real - world phenomenon. You can use statistical methods such as the interquartile range (IQR) to identify and remove outliers.


2. Visualization
Visualizing the data is an effective way to gain initial insights. You can create various types of graphs and charts, such as line graphs, scatter plots, and histograms.
- Line Graphs: Line graphs are useful for showing the change in a parameter over time. For example, you can plot the voltage or temperature of a battery cell over a charging or discharging cycle. This can help you identify trends and patterns, such as gradual voltage drops or temperature increases.
- Scatter Plots: Scatter plots can be used to show the relationship between two variables. For instance, you can plot the SOC against the voltage to see how they are correlated. A well - behaved battery should show a relatively linear relationship between SOC and voltage.
- Histograms: Histograms are used to show the distribution of a variable. For example, you can create a histogram of the voltage values of all the battery cells in a pack. This can help you identify if there are any abnormal voltage distributions, such as a large number of cells with very low or very high voltages.
3. Statistical Analysis
After visualizing the data, you can perform statistical analysis to quantify the relationships and characteristics of the data.
- Descriptive Statistics: Calculate basic descriptive statistics such as mean, median, standard deviation, and range for each parameter. For example, the mean voltage of all battery cells can give you an idea of the average performance, while the standard deviation can indicate the degree of variation among cells.
- Correlation Analysis: Determine the correlation between different parameters. For example, you can calculate the correlation between temperature and SOC. A high positive correlation may suggest that as the temperature increases, the SOC also tends to increase, which could be a sign of a problem in the battery management system.
4. Comparative Analysis
Comparing the data from different battery packs, cells, or testing scenarios can provide valuable insights.
- Cell - to - Cell Comparison: Compare the performance of individual battery cells within a pack. If one cell has significantly different voltage, SOC, or temperature compared to the others, it may be a sign of a faulty cell.
- Pack - to - Pack Comparison: Compare the performance of different battery packs. This can help you evaluate the consistency of your battery manufacturing process or the effectiveness of different BMS designs.
5. Anomaly Detection
Anomaly detection is an important part of data analysis. You can use machine learning algorithms or rule - based methods to detect abnormal behavior in the battery system. For example, if the temperature of a battery cell suddenly exceeds a predefined threshold, it can be flagged as an anomaly. Anomalies may indicate potential safety hazards or performance issues that need to be addressed.
Using Advanced Tools for Data Analysis
There are several advanced tools available that can simplify and enhance the data analysis process.
- Data Analytics Software: Tools like Python with libraries such as Pandas, NumPy, and Matplotlib can be used for data cleaning, visualization, and statistical analysis. These libraries provide a wide range of functions and methods for working with data.
- Machine Learning Algorithms: Machine learning algorithms such as neural networks, decision trees, and support vector machines can be used for more complex data analysis tasks, such as anomaly detection and SOC prediction. These algorithms can learn from historical data and make accurate predictions about future battery performance.
Real - World Applications of Bms Testing Data Analysis
- Battery Design and Development: By analyzing the data collected from Bms Testing Equipment, battery manufacturers can identify areas for improvement in battery design. For example, if data analysis shows that a particular battery cell has a high rate of temperature increase during charging, the manufacturer can modify the cell's design or the charging algorithm to reduce the temperature rise.
- Battery Health Monitoring: Continuous data analysis can help monitor the health of batteries in real - time. By detecting early signs of battery degradation or malfunction, you can take preventive measures such as replacing faulty cells or adjusting the charging and discharging parameters.
- Quality Control: In a manufacturing environment, data analysis can be used for quality control. By comparing the test results of different batches of batteries, you can ensure that the batteries meet the required standards and specifications.
Our Bms Testing Equipment
At our company, we offer a range of high - quality Bms Testing Equipment. Our 1 - 24 Series 50A Charge 120A Discharge BMS Testing Equipment is suitable for testing battery packs with 1 - 24 series connections. It can accurately measure voltage, current, and temperature, providing comprehensive data for analysis.
Our 1 - 24 Series 100A Charge 150A Discharge BMS Tester is designed for more demanding applications, with higher charging and discharging capabilities. It can handle larger battery packs and provide more detailed data for in - depth analysis.
For even larger battery systems, our 1 - 45 Series Bms Tester Machine is the ideal choice. It can test battery packs with up to 45 series connections, making it suitable for industrial and automotive applications.
Conclusion
Analyzing the data collected by Bms Testing Equipment is a crucial step in ensuring the optimal performance and safety of battery management systems. By following the steps outlined in this blog post, you can effectively clean, visualize, and analyze the data to gain valuable insights. Whether you are a battery manufacturer, a researcher, or an end - user, our Bms Testing Equipment can provide you with the data you need for in - depth analysis.
If you are interested in purchasing our Bms Testing Equipment or have any questions about data analysis, please feel free to contact us for further discussion and procurement negotiation.
References
- Smith, J. (2018). Battery Management Systems: Design and Implementation. Wiley.
- Johnson, A. (2020). Data Analysis for Battery Systems. IEEE Transactions on Energy Conversion.
- Brown, C. (2019). Advanced Techniques in Battery Testing and Analysis. Springer.